Results at carrier scale
Modelled cost estimate: fuel, charter, and demand-leakage analysis at 400-vessel scale. Full methodology is in the annexe.
When the map changes overnight
In late 2023, Bab-el-Mandeb effectively closed to commercial traffic. Around five hundred container vessels rerouted around the Cape of Good Hope, adding up to fourteen days and roughly a million dollars in extra bunker cost per voyage. Simultaneously, a historic drought cut Panama Canal transits by more than a third. Alliances that had taken years to negotiate were being rewritten under pressure, mid-cycle.
The industry had spent a decade building visibility: real-time vessel tracking, port call dashboards, cargo positioning across the supply chain. When the corridors closed, operators found out what visibility is worth in a disruption.
That gap, between knowing a route has closed and knowing what to do about it, is where the money goes. Not in one catastrophic decision, but in dozens of slightly wrong ones, made under pressure, by planning teams working faster than their tools allow. The problem is structurally the same across every segment. Only the cargo type changes.
“You can see exactly where every box is. That does not tell you where to send the ship.”
Four things that are now true
Four shifts have moved network re-optimisation from a back-office planning task to a front-line competitive variable:
- Decision latency costs more than bad assets. Most carriers can identify a network problem within hours. Fixing it, building a validated alternative, getting commercial alignment, and updating operations, takes weeks. At scale, that lag has been estimated to cost over $50M per year. Not from one bad call, but from dozens of serviceable ones made because there was not time to find the better option.
- The maths behind liner network design is genuinely hard. The Liner Shipping Fleet Routing Problem, which vessels serve which ports at what speed with cargo flows routed across the result, involves over 14 million binary decision variables at carrier scale. Traditional solvers need days just to find a feasible answer. That was acceptable for annual planning. It is not acceptable when a canal closes on Tuesday and commercial teams need an answer before the week is out.
- A different approach now exists, and it has been validated at scale. Using intelligent local search combined with mathematical proof of optimality, a complete network of 400+ vessels can be re-solved from scratch in approximately 60 minutes. The output is not indicative. It is deployable. No carrier has done this before at this scale.
- Who re-optimises fastest will win the next decade's disruptions. The carriers that capture cargo from the next Red Sea event will not necessarily have the most vessels. They will have the shortest gap between the market moving and having a new network, validated and ready to run.
Why annual planning no longer works
Reviewing a network once or twice a year made sense when trade lanes were stable, canal capacity was reliable, and bunker prices moved in a forecastable range. Those conditions no longer hold, and there is no reason to expect them to return. Four things changed, and none of them look temporary:
- Geopolitics became a live planning variable. Red Sea, Panama, Hormuz: corridors once treated as permanent infrastructure are now conditional. Carriers are redesigning services on 48-hour notice.
- Alliance structures kept shifting. The cooperation frameworks that underpinned network design for a decade changed repeatedly, forcing mid-cycle redesigns on assumptions that were already out of date.
- Bunker economics move faster than planning cycles. The spread between slow-steam and full-speed economics on a major string can swing a service's P&L by millions. An annual plan cannot track it.
- Cargo flows got less predictable. Post-2020, last year's origin-destination volumes became an unreliable guide to next year's. Demand shocks in both directions have shortened the useful life of any fixed demand forecast.
The real diagnosis
When a network underperforms, the first conversation is usually about ships: wrong sizes, insufficient capacity, charter costs too high. These are real problems, but they are downstream of the actual issue.
The actual issue is how long it takes to go from the market has shifted to here is our revised network, tested and ready to execute. For most carriers, that journey runs to weeks. The planning team is running scenarios in Excel. Operations and commercial are working from different assumptions. By the time a defensible answer emerges, the commercial window has often passed.
A real-time visibility platform tells the planning desk within minutes that a corridor has closed. What it cannot do, in minutes or hours, is show what the best re-routing, vessel redeployment and service redesign looks like across 80 services and 400 vessels, while holding to the slot commitments already made to customers.
“At carrier scale, the cumulative cost of a single poor network configuration, left in place for a planning cycle, has been estimated at over $50M annually. That is not the cost of one bad decision. It is the accumulated drag of consistently choosing from too few options, too slowly.”
What it actually looks like
A corridor closes: Bab-el-Mandeb, a Panama slot restriction, a major port congestion event. The notice period is 48 hours, sometimes less. By the end of that first day, every desk is waiting on the same answer:
“When Red Sea routing collapsed in late 2023, operators who normally had months to redesign services had days. The gap between those who responded in days and those who took weeks was not a planning failure. It was a tooling failure. The teams knew what needed to change. They just could not calculate it fast enough.”
- Operations needs to know which vessels can reroute and what the extra steaming costs.
- Commercial is fielding calls about which slot commitments survive and which customers need a conversation.
- Charterers and shippers want revised ETAs, and they want them now.
- Finance wants a cost exposure figure before any rerouting is authorised.
What changes with optimisation-driven network design
The planning team is pulling up scenario templates from the last disruption, updating what still applies, running sensitivities in spreadsheets. Weeks pass before a fully tested answer is ready to present. Carriers who get there first capture the displaced cargo, and sometimes the customer relationship that comes with it. The difference between the two operating models is stark across every dimension:
Traditional planning vs optimisation-driven design
Planning cadence
Traditional planning
Annual or semi-annual
Optimisation-driven design
Continuous, triggered by real conditions
Scenario speed
Traditional planning
Days to weeks; few alternatives tested
Optimisation-driven design
Minutes to hours; many alternatives compared
Disruption response
Traditional planning
Manual, reactive, slow
Optimisation-driven design
Rapid re-solve with a validated, deployable plan
Commercial alignment
Traditional planning
Siloed; conflicts surface late
Optimisation-driven design
Commercial constraints built into the optimisation
Decision confidence
Traditional planning
Experience plus limited comparison
Optimisation-driven design
Quantified across many options; gap to optimal certified
Network profitability
Traditional planning
Drifts as conditions change
Optimisation-driven design
Stays closer to optimal continuously
| Dimension | Traditional planning | Optimisation-driven design |
|---|---|---|
| Planning cadence | Annual or semi-annual | Continuous, triggered by real conditions |
| Scenario speed | Days to weeks; few alternatives tested | Minutes to hours; many alternatives compared |
| Disruption response | Manual, reactive, slow | Rapid re-solve with a validated, deployable plan |
| Commercial alignment | Siloed; conflicts surface late | Commercial constraints built into the optimisation |
| Decision confidence | Experience plus limited comparison | Quantified across many options; gap to optimal certified |
| Network profitability | Drifts as conditions change | Stays closer to optimal continuously |
The competitive picture
The last twenty years of maritime competition were won on scale: bigger vessels, stronger alliances, lower cost per TEU-mile. That logic still holds, but it no longer dominates the outcome.
The disruptions of 2023 exposed the other side of scale: a large, slow-moving network absorbs a shock more expensively than a smaller one that can reconfigure quickly. A 20,000 TEU vessel is not an asset when it is on the wrong string and the planning cycle takes three months to fix it.
The edge in the next decade goes to the operator who produces a validated network response faster than the competition. Not because speed is strategically elegant, but because in a disruption, the cargo goes to whoever answers first with a credible offer. First movers on this capability will not just manage disruptions better. They will be positioned to take commercial advantage of them, which is a materially different outcome.
The next disruption will not announce itself. When it comes, the question is whether your planning team has 60 minutes or 60 days.
Annexe: two engines, one solve
This annexe sets out the methodology behind the paper's claims, for planning teams, technical evaluators, and advisors.
The Liner Shipping Fleet Routing Problem is, bluntly, one of the hardest combinatorial problems in operations research. At the scale of a major global carrier, 100+ ports, 400+ vessels, 80+ concurrent services, and 11,000+ origin-destination pairs across 14+ global regions, a complete network redesign involves replacing over 14 million binary decision variables. Traditional Mixed-Integer Programming solvers, at this scale, need days to find even a feasible answer. Not an optimal one. A feasible one. The Solverminds approach runs two engines in sequence:
Two engines, one solve
Full network redesign using intelligent local search. Replaces 14M+ binary decision variables and produces a high-quality, feasible network in approximately 60 minutes at real carrier scale, versus days for traditional MIP solvers.
Engine B: precision, proof of optimality
Certifies that any given network is within a quantified, proven gap of the mathematical optimum. The final word before publishing a schedule or signing an alliance: verified, not assumed.
| Engine A: speed, minutes not days | Engine B: precision, proof of optimality |
|---|---|
| Full network redesign using intelligent local search. Replaces 14M+ binary decision variables and produces a high-quality, feasible network in approximately 60 minutes at real carrier scale, versus days for traditional MIP solvers. | Certifies that any given network is within a quantified, proven gap of the mathematical optimum. The final word before publishing a schedule or signing an alliance: verified, not assumed. |
What the system does
Speed without proof is a faster guess. Proof without speed is useless in a disruption. The combination, a verifiable and deployable network in approximately 60 minutes, is what changes the planning calculus. This is not described as AI-driven, because that label carries no technical precision. It is optimisation-driven: the output of a mathematically grounded process with a quantified, auditable gap to the theoretical optimum. In practice that supports:
- Scenario response: canal closure, fleet change, or demand shock answered with a validated result in minutes to hours, not the following week.
- Full network redesign from scratch, when incremental changes to the existing plan are no longer adequate.
- Fleet and vessel-size matching against current demand and bunker economics, not the assumptions that were true when the fleet was planned.
- Alliance and BSA stress-testing: model a proposed slot exchange or cooperation agreement against the network before committing, and discover the conflicts before signing rather than after.
- Cargo routing across own and partner capacity: for every origin-destination pair, the most profitable path across owned services, feeder connections, transshipment, and, where unavoidable, slot purchases.
- Port and terminal capacity planning: investment decisions grounded in optimisation-based demand modelling, not static point forecasts.
- Continuous re-solve: not an annual project, but a capability that runs as often as conditions require.
Validated results, in full
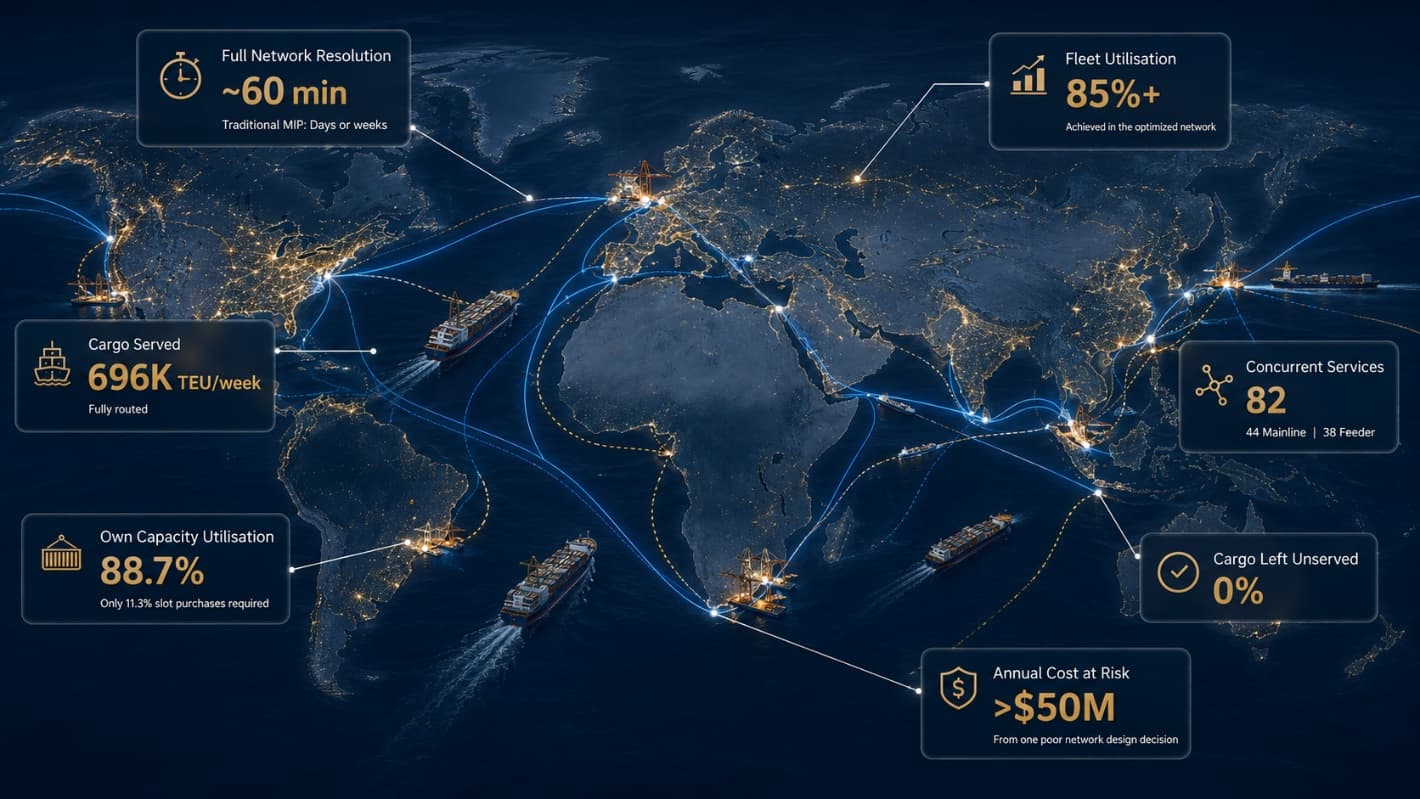
The figures in the main paper are drawn from a single optimisation run on a complete global network: 97 ports, 397 of 466 available vessels deployed, 82 services (44 mainline, 38 feeder), 10,929 OD pairs across 14 global regions, and 696K TEU per week of demand. One solve. The numbers below are the output:
Validated output from a single global-network solve
~60 min
Detail
Full network resolve, versus days or weeks for traditional MIP
85%+
Detail
Fleet utilisation achieved in the optimised network
0%
Detail
Cargo left unserved (696K TEU per week fully routed)
82
Detail
Concurrent services (44 mainline, 38 feeder)
11.3%
Detail
Slot purchases only; 88.7% served on own plus feeder capacity
$50M+
Detail
Annual cost at risk from one poor network decision at scale
| Result | Detail |
|---|---|
| ~60 min | Full network resolve, versus days or weeks for traditional MIP |
| 85%+ | Fleet utilisation achieved in the optimised network |
| 0% | Cargo left unserved (696K TEU per week fully routed) |
| 82 | Concurrent services (44 mainline, 38 feeder) |
| 11.3% | Slot purchases only; 88.7% served on own plus feeder capacity |
| $50M+ | Annual cost at risk from one poor network decision at scale |
Cargo movement breakdown
Of the 696K TEU per week of demand in the validated network, the solver routed the great majority on the carrier's own capacity:
“The objective function minimises slot purchases while holding fleet utilisation above 85% and leaving zero demand unserved. The 11.3% slot-purchase figure is the floor, not a target.”
- 33.1% routed directly on the carrier's own services.
- 54.2% moved via feeder connections and transshipment within the carrier's own network.
- 11.3% covered by slot purchases, the residual after the solver has exhausted own-network options.
What it means, by role
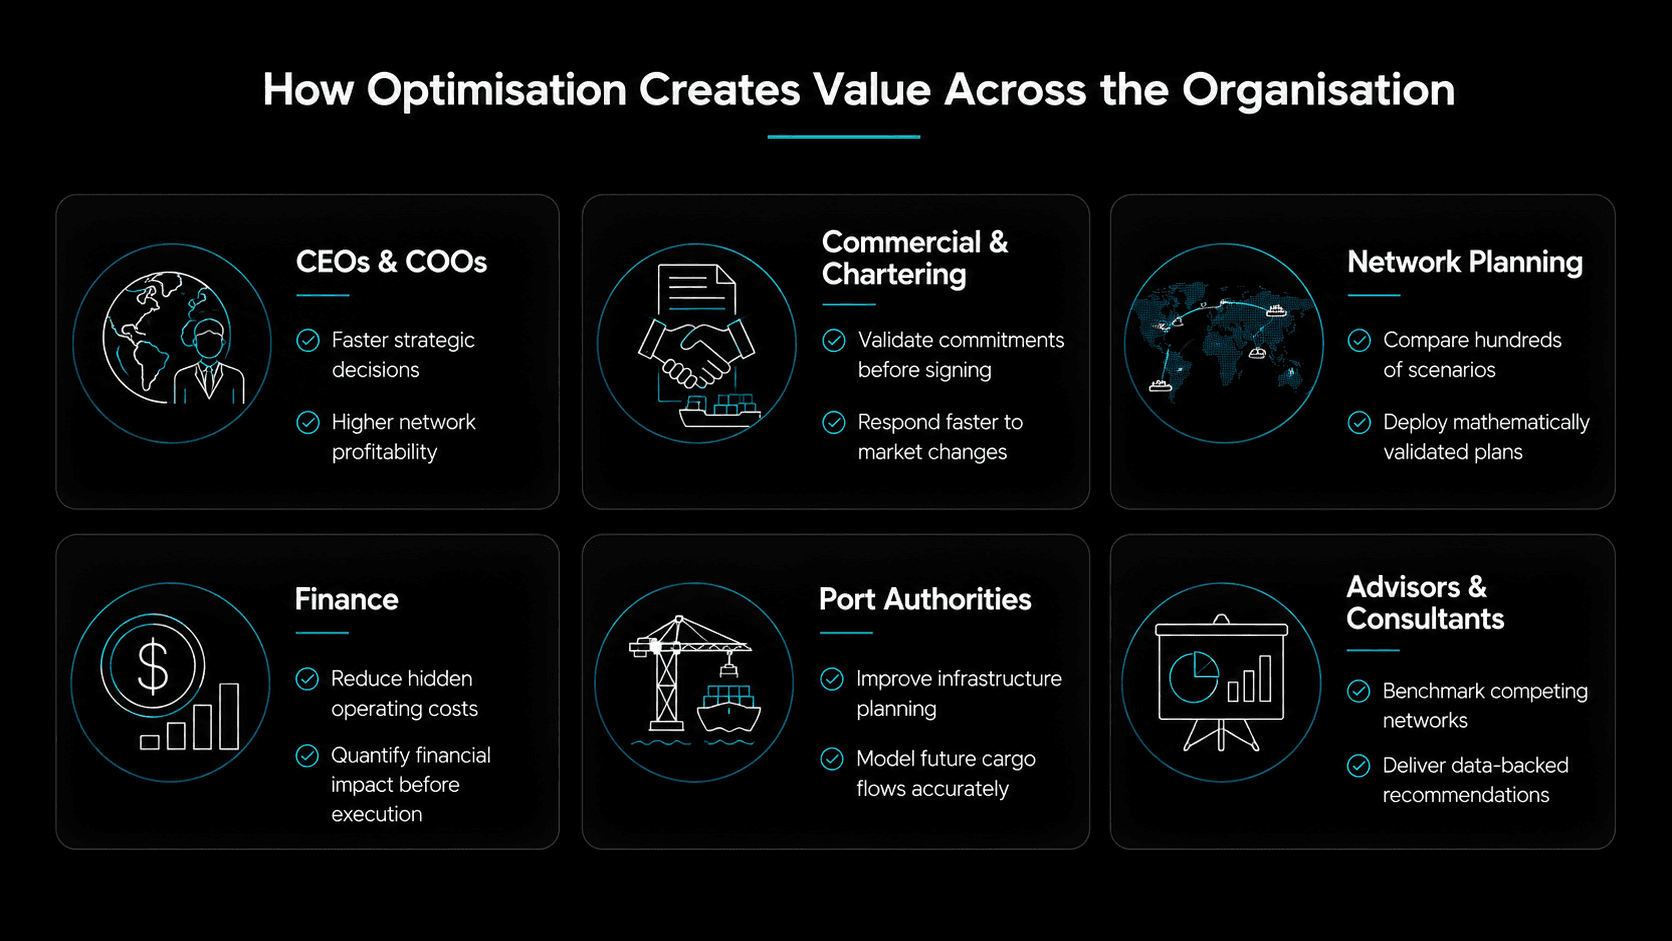
The same capability reads differently depending on where you sit. The methodology behind the $50M+ figure is a modelled estimate across four cost components at 400-vessel scale: the fuel cost of suboptimal routing relative to the optimised baseline; the charter cost of vessel misallocation; revenue leakage from demand diverted to slot purchases at a market premium; and the opportunity cost of delayed commercial commitment. It represents the annual drag of one poor configuration persisted across a full planning cycle, not a one-time event cost.
- CEOs and COOs (liners, tanker owners, bulk operators): the network is the largest single capital allocation in the business, and in most carriers it runs on a plan last reviewed months ago. The test is simple: if a major corridor closed tomorrow, how long before your team has a validated alternative ready to execute? If the answer is weeks, that lag has a dollar value, and the $50M annual estimate here is a conservative one at scale.
- Commercial and chartering leaders: commitments are made against assumptions about what the network can support, and those assumptions often stay in place until a problem surfaces. This lets commercial teams test whether the network supports a commitment before making it, and generate a credible alternative when it does not.
- Network planning and fleet management: the constraint is not intelligence, it is the number of scenarios that can be evaluated before a decision has to be made. Manual scenario-building in Excel produces three or four options. This produces hundreds, certified against the mathematical optimum, with the best surfaced for human review. The planner's job shifts from building scenarios to judging them.
- Finance: network decisions carry consequences currently visible only after the fact, in fuel costs, charter rates, slot premiums, and lost revenue. This makes them visible upfront, as inputs to the decision rather than explanations of its outcome.
- Consultancies and advisors: the standard toolkit is qualitative benchmarking and high-level financial modelling. This adds quantitative network optimisation at carrier scale, with mathematically certified output. When a client asks why a competitor's network performs better, the answer can now include the specific configuration difference and the cost of closing it.